Debugging SpiceDB Checks
While it is recommended that SpiceDB schema be validated and tested before production deployment, there are many scenarios in which being able to see the actual paths taken against production data is incredibly important.
To support this use case the CheckPermission API supports a special debug header which can be used to retrieve the full set of relations and permission traversed in order to compute the result.
Calling the CheckPermission API with the debug header set will result in a small, but noticable performance penalty. It is highly recommended to not set this header unless a trace is required.
Displaying explanations via zed
The simplest way to use the tracing system is to use the zed CLI tool with the --explain flag:
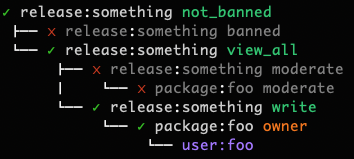
zed permission check release something not_banned user foo --explain
The result of the check will be displayed graphically, with permissions in green and relations in orange:
Cached results
If the result for a CheckPermission has already been cached by SpiceDB, then that will be indicated:
![]()
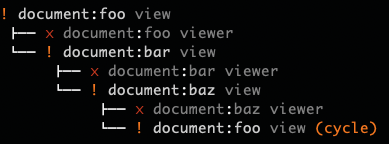
Cycle detection
If the schema and relationships within SpiceDB forms a cycle, it will be indicated in the output:
Using the tracing API directly
If you wish to call CheckPermission and retrieve the debug traces directly, there are a few steps involved:
- Set the header
io.spicedb.requestdebuginfoto valuetrueon the request - Retrieve the trailer
io.spicedb.respmeta.debuginfoand parse the JSON found within as a DebugInformation message.